6.7.4 Performance calculations
The calculation consists of 6 phases.The initial phase consists of the generation of the initial stresses using the K0 procedure.The next phase consists of the installation of the sheet piles and the first excavation.Then the waling and struts will be installed.In phase 3,the ground anchors will be activated and prestressed.Further excavation will be performed in the phase after that.The last phase will be the application of the additional load next to the pit.
Click on the Staged construction tab to proceed with definition of the calculation phases.
The initial phase has already been introduced.Keep its calculation type as K0 procedure.Make sure all the soil volumes are active and all the structural elements are inactive.
Add a new phase(phase⁃1).The default values of the parameters will be used for this calculation phase.
Deactivate the first excavation volume(from z=0 to z=-1).
In the Model/explorer,activate all plates and interfaces by clicking on the checkbox in front of them.The active elements in the project are indicated by a green check mark in the Model explorer.
Add a new phase(Phase⁃2).The default values of the parameters will be used for this calculation phase.
In the Model explorer activate all the beams.
Add a new phase(Phase⁃3).The default values of the parameters will be used for this calculation phase.
In the Mode/explorer activate the Groundanchors group.
Select one of the node⁃to⁃node anchors.
In the Selection explorer expand the node⁃to node anchor features.
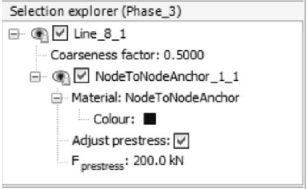
Click on the Adjust prestress checkbox.Enter a prestress force of 200 kN(Figure 6.20).
Do the same for all the other node⁃to⁃node anchors.

Figure 6.20 Node⁃to⁃node anchor in the Selection explorer
Add another phase(Phase⁃4).The default values of the parameters will be used for this calculation phase.
Select the soil volume to be excavated in this phase(between z=-1 and z=-6.5).
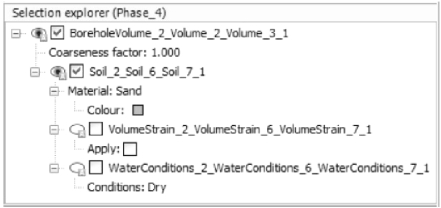
In the Selection explorer under waterconditions feature,as shown in Figure 6.21,click on the Conditions and select the Dry option from the drop⁃down menu.

Figure 6.21 Water conditions in the Selection explorer
Deactivate the volume to be excavated(between z=-1 and z=-6.5).
Hide the soil and the plates around the excavation.
Select the soil volume below the excavation(between z=-6.5 and z=-9.5).
In Selection explorer under Waterconditions feature.
Click Conditions and select Head from the drop⁃down menu.Enter zref=-6.5 m.
Select the soft clay volume below the excavation.
Set the water conditions to Interpolate.
Preview this calculation phase.
Click the Vertical cross section button in the Preview window and define the cross section by drawing a line across the excavation.
Select the psteady option from the Stresses menu.
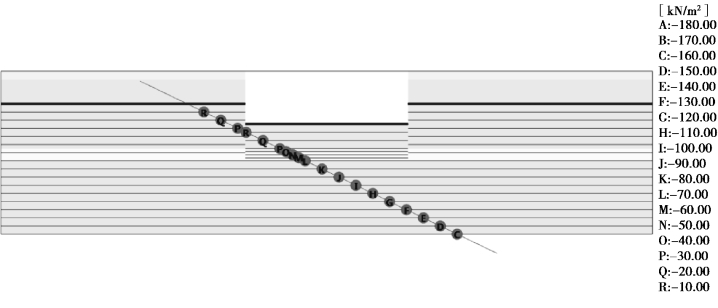
Display the contour lines for steady pore pressure distribution.Make sure that the Legend option is checked in View menu.The steady state pore pressure distribution is displayed in Figure 6.22.Scroll the wheel button of the mouse to zoom in or out to get a better view.
Change the legend settings to:
Scaling:manual
Maximum value:0
Number of intervals:18
Click on the Close button to return to the Input program.
Add another phase(Phase⁃5).The default values of the parameters will be used for this calculation phase.
Activate the surface load and setσz=-20 kN/m2.

Figure 6.22 Preview of the steady state pore pressures in Phase⁃4 in a cross section
Defining points for curves
Before starting the calculation process,some stress points next to the excavation pit and loading are selected to plot a stress strain curve later on.
Click the Select points for curves button.The model and Select points window will be displayed in the Output program.
Define(37.5 19-1.5)as Point⁃of⁃interest coordinates.
Click the Search closest button.The number of the closest node and stress point will be displayed.
Click the checkbox in front of the stress point to be selected.The selected stress point will be shown in the list.
Select also stress points near the coordinates(37.5 19-5),(37.5 19-6)and(37.5 19-7)and close the Select points window.
Click the Update button to close the Output program.
Start the calculation process.
Save the project when the calculation is finished.
To plot curves of structural forces,nodes can only be selected after the calculation.
Nodes or stress points can be selected by just clicking them.When moving the mouse,the exact coordinates of the position are given in the cursor location indicator bar at the bottom of the window.
