6.7.5 Viewing the results
After the calculations,the results of the excavation can be viewed by selecting a calculation phase from the Phases tree and pressing the View calculation results button.
Select the final calculation phase(Phase⁃5)and click the View calculation results button.The Output program will open and show the deformed mesh at the end of the last phase.
The stresses,deformations and three dimensional geometry can be viewed by selecting the desired output from the corresponding menus.For example,choose Plastic points from the Stresses menu to investigate the plastic points in the model.
In the Plastic points window,Figure 6.23,select all the options except the Elastic points and the Show only inaccurate points options.Figure 6.24 shows the plastic points generated in the model at the end of the final calculation phase.
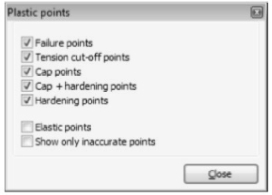
Figure 6.23 Plastic points window
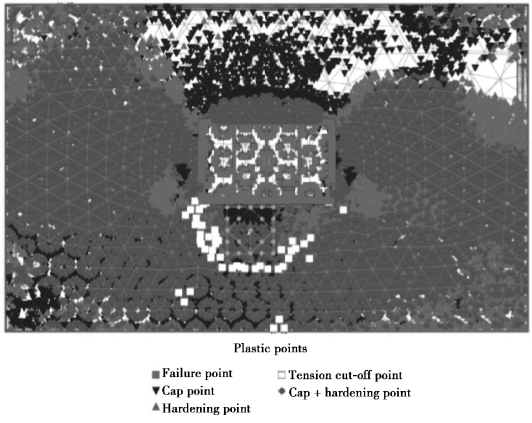
Figure 6.24 Plastic points at the end of the final phase
The graph of Figure 6.25 will now show the major principal strain against the major principal stress.Both values are zero at the beginning of the initial conditions.After generation of the initial conditions,the principal strain is still zero;whereas the principal stress is not zero anymore.To plot the curves of all selected stress points in one graph,follow these steps:
•Select Add curve—From current project from right mouse button menu.
•Generate curves for the three remaining stress nodes in the same way.
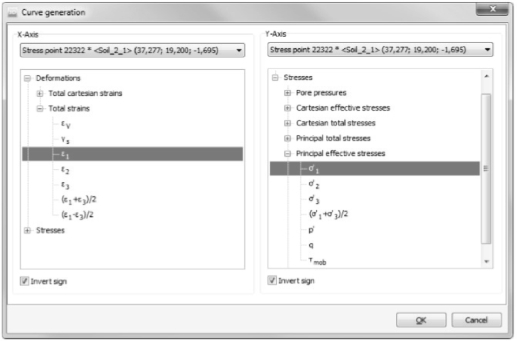
Figure 6.25 Curve generation window
The graph will now show the stress⁃strain curves of all four stress points(Figure 6.26).To see information about the markers,make sure the Value indication option is selected from the View menu and hold the mouse on a marker for a while.Information about the coordinates in the graph,the number of the point in the graph,the number of the phase and the number of the step is given.Especially the lower stress points show a considerable increase in the stress when the load is applied in the last phase.To create a stress path plot for stress node(37.5 19-1.5),follow these steps:
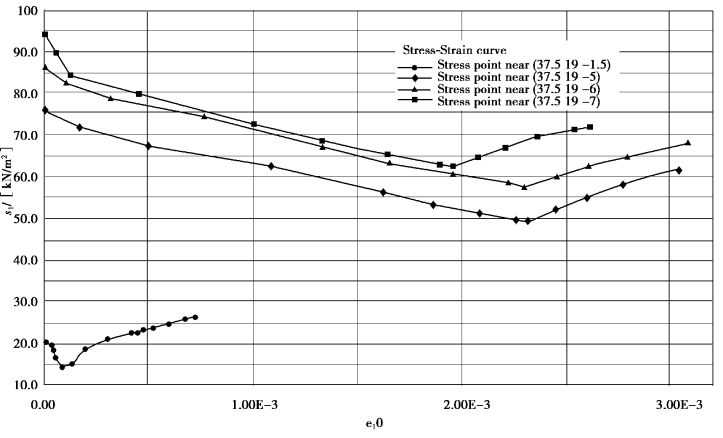
Figure 6.26 Stress⁃strain curve
•Create a new chart.
•In the Curves generation window,select node(37.5 19-1.5)from the drop⁃down menu of the x⁃axis of the graph and under Cartesian effective stresses.
•Select node(37.5 19-1.5)from the drop⁃down menu of the y⁃axis of the graph.Selectσ′zz under Cartesian effective stresses.
•Click OK to confirm the input(Figure 6.27).
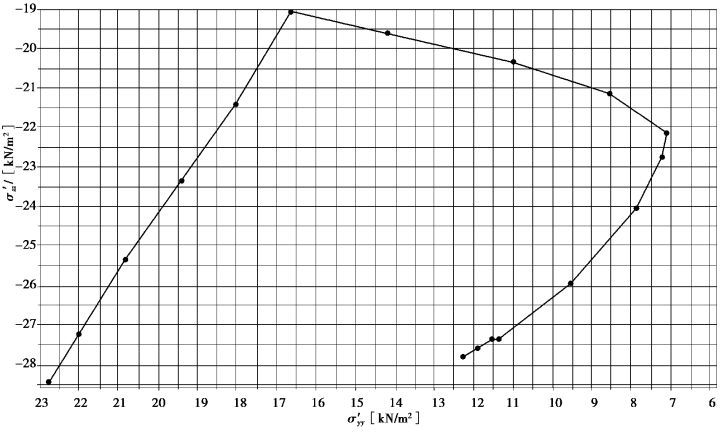
Figure 6.27 Vertical effective stress(σ′zz)versus horizontal effective stress(σ′yy)at stress node located near(37.5 19-1.5)
