Model test
In order to verify the stability of the model,this paper takes another angle to decompose the data.
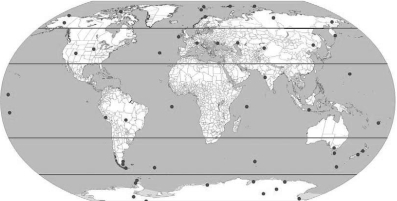
First of all,according to the site of the distribution of different regions.The partitions are shown in the Table 1 below.
Table 1 The distribution of the selected sites

Appears on the map as Figure 8:

Figure 8(https://www.daowen.com)
Figure 8:The red markings on the map are the selected sites,with ten sites selected for each latitude zone,with their mean values representing the average ozone content for the entire latitude zone.
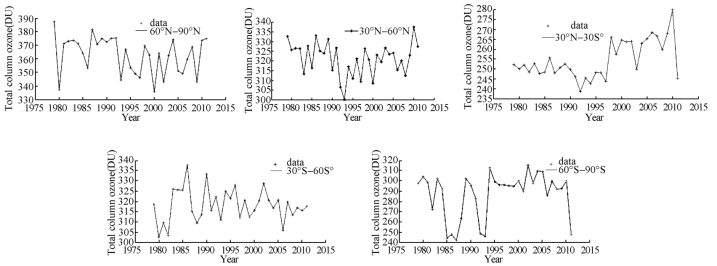
In the corresponding latitude band,select the average of all stations measured data as the ozone content of the latitude band.In this way,we obtain the distribution of ozone in the five latitudes.According to the established DHR model for each latitude band analysis,the following conclusions can be drawn as Figure 9.

Figure 9
For the equatorial region,the periodic component accounts for the largest proportion,explaining nearly 85%of the variance.Because of the role of atmospheric circulation,ozone depletion by the material in the equator cannot stay a long time,so in the equatorial ozone content is mainly affected by solar activity.
The northern hemisphere high-latitude belt relative to the southern hemisphere high-latitude zone,the ozone content loss is lighter.In the Antarctic region,there are significant ozone holes.Mainly due to the influence of atmospheric circulation.On the other hand,the predicted recovery rate of ozone near the Antarctic is faster than that near the Arctic.
Comparing the predicted results with the global ones,the difference is not obvious,and the prediction curve still falls within the 95%confidence interval of the global model.
